


Data
Data

Understanding i-Ready Reports
Families will be receiving individual student reports sharing how their learner performed on the most recent i-Ready assessment. The resources below will guide families in understanding the information that is shared within their report.
Region North Fingertip Facts
Together is Better | 2025–26 Enrollment Snapshot
Enrollment Overview
Enrollment data for Region North schools.
| Category | # of Students |
|---|---|
| Total Enrollment | 134,000 |
| English Learners (ETK–12) | 23,348 |
| PSEL Enrollment | 48,031 |
| GATE Enrollment | 20,539 |
| BSAP Enrollment | 6,540 |
| Free & Reduced Lunch | 100,804 |
| Ethnicity | # of Students |
|---|---|
| 2 or MORE | 3,038 |
| African American/Black | 3,764 |
| American Indian/Alaska Native | 86 |
| Asian | 6,774 |
| Filipino | 3,052 |
| Hispanic | 90,163 |
| Pacific Islander | 175 |
| Unknown | 3,910 |
| White | 23,038 |
| Grand Total | 134,000 |
| Language Classification | # of Students |
|---|---|
| EO | 67,981 |
| IFEP | 8,949 |
| LEP | 23,349 |
| RFEP | 31,144 |
| Unknown | 2,577 |
| Grand Total | 134,000 |
Notes: “PSEL” = Primary School for Enriched Learning; “BSAP” = Black Student Achievement Plan; “EO” = English Only; “IFEP” = Initially Fluent English Proficient; “LEP” = Limited English Proficient; “RFEP” = Reclassified Fluent English Proficient.
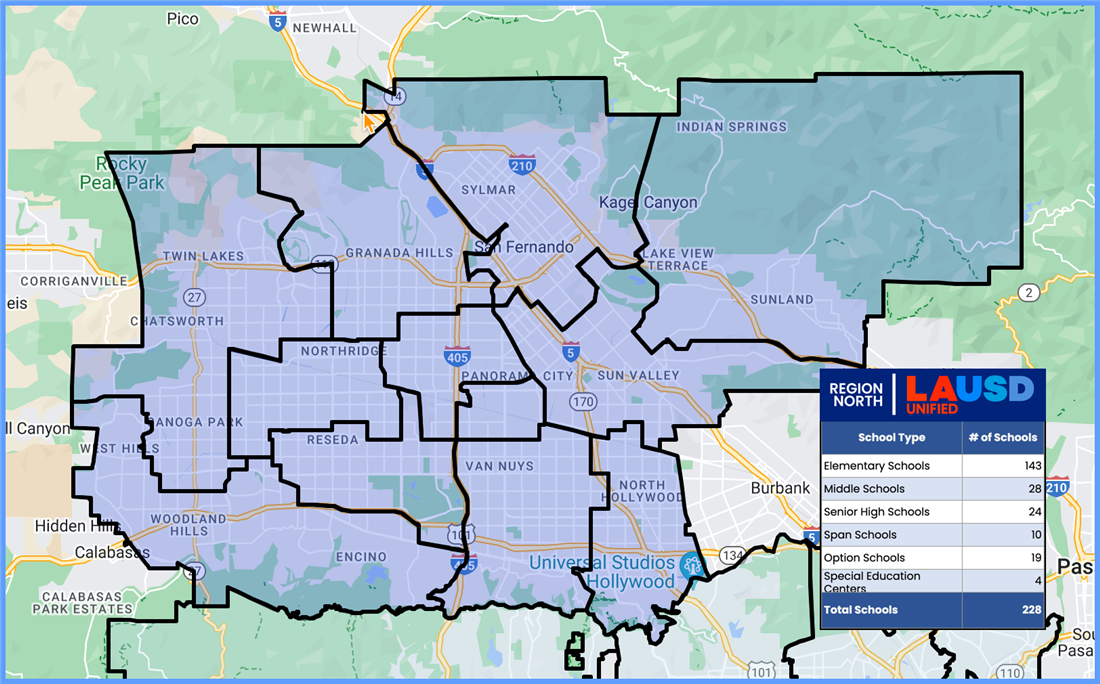
Geography
Region North spans 312 square miles. This is 44% of the entire LAUSD area.


Mission Statement
The mission of the Office of Data and Accountability is to collect, verify, analyze, and report student demographic and achievement data that informs the operational and instructional practice in our schools.